
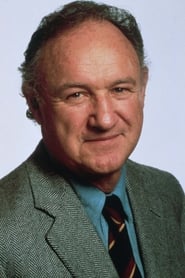

HEAD-TO-HEAD COMPARISON
#4
#1
#4
#1
1
1
1
1
4.0
1.0
22
17
Superman $134.2 Million
Nine to Five $103.3 Million
$651.6 Million
Box Office
$435.5 Million
COMMUNITY VOTE
Who had the greater Hollywood career overall?
Cast your vote and compare your opinion with the community.
✓ Thanks for voting!
0 community votes
Community voting reflects visitor opinion and is independent of the Hollywood Rankings methodology.
CAREER RANKING HISTORY
FILMOGRAPHY COMPARISON
Gene Hackman
22 theatrical releases • $651.6 Million Domestic
| Year | Movie | Domestic Box Office Domestic BO |
|---|---|---|
| 1980 | Superman II | $108.2 Million |
| 1978 | Superman | $134.2 Million |
| 1977 | The Domino Principle | $1.8 Million |
| 1977 | March or Die | $1.0 Million |
| 1977 | A Bridge Too Far | $50.8 Million |
Jane Fonda
17 theatrical releases • $435.5 Million Domestic
| Year | Movie | Domestic Box Office Domestic BO |
|---|---|---|
| 1980 | Nine to Five | $103.3 Million |
| 1979 | The Electric Horseman | $61.8 Million |
| 1979 | The China Syndrome | $51.7 Million |
| 1978 | Coming Home | $32.7 Million |
| 1978 | Comes a Horseman | $9.6 Million |
Career Comparison Summary AI-generated historical comparison. Click to expand.
Note: Films released during the selected year influence the following year's rankings.
At this point in the rankings, Gene Hackman versus Jane Fonda is best read as a compact career snapshot rather than an all-time verdict. Average Rank adds useful texture here, pointing to Jane Fonda as the steadier high-ranking presence across eligible seasons.
Commercial scale is another meaningful divider, with the career domestic box office measure giving Gene Hackman the larger theatrical footprint. From a historical perspective, the matchup stays evenly split and remains tied to the selected ranking season.